Visual Evaluation
Visual Evaluation
Let’s look at the forecasts for German GDP in the OUTPUT tab. As you can see in the video below, you need to select the sample you want to visualize and select the different points in time (i.e. forecasting horizons) in which the forecasts are computed. For example, fh(44) represents the forecast obtained 44 days after the quarter has ended, while fh(-30) is obtained 30 days before the end of the quarter. The yellow bars represent the Flash GDP growth for Germany, which is the target we want to anticipate:

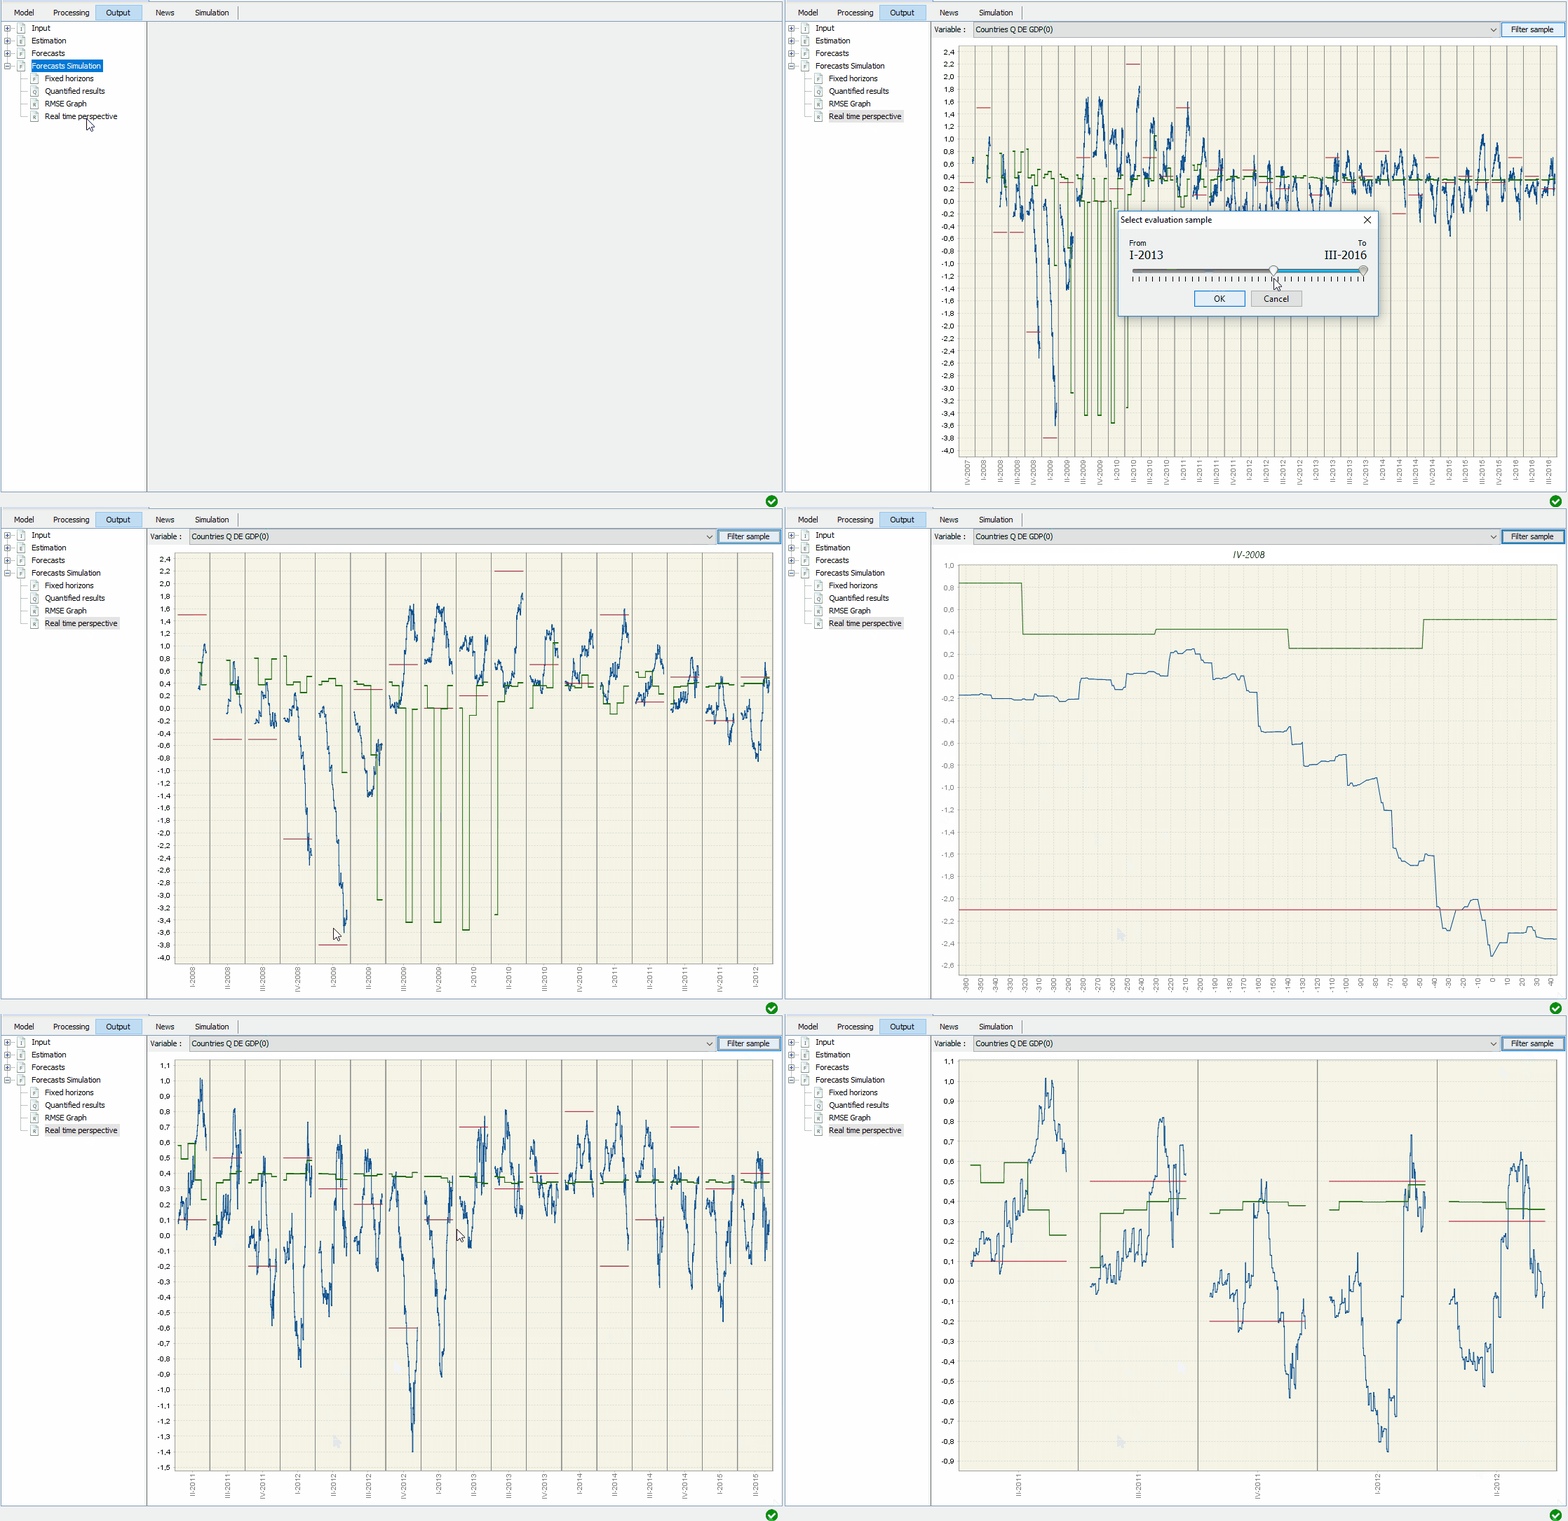
We can look at the forecasts from a different perspective. The following video shows how the program represents the continuous evolution of the nowcasts for all quarters selected. The nowcasts from the multivariate dynamic factor model (in blue) can be compared with the naïve forecasts coming from an ARIMA model (in green color), while the actual GDP growth rates is represented by a red line. The graphical interface also allows users to focus on a particular quarter by double clicking on it:
