Example euro area
Example 1: Updating euro area GDP
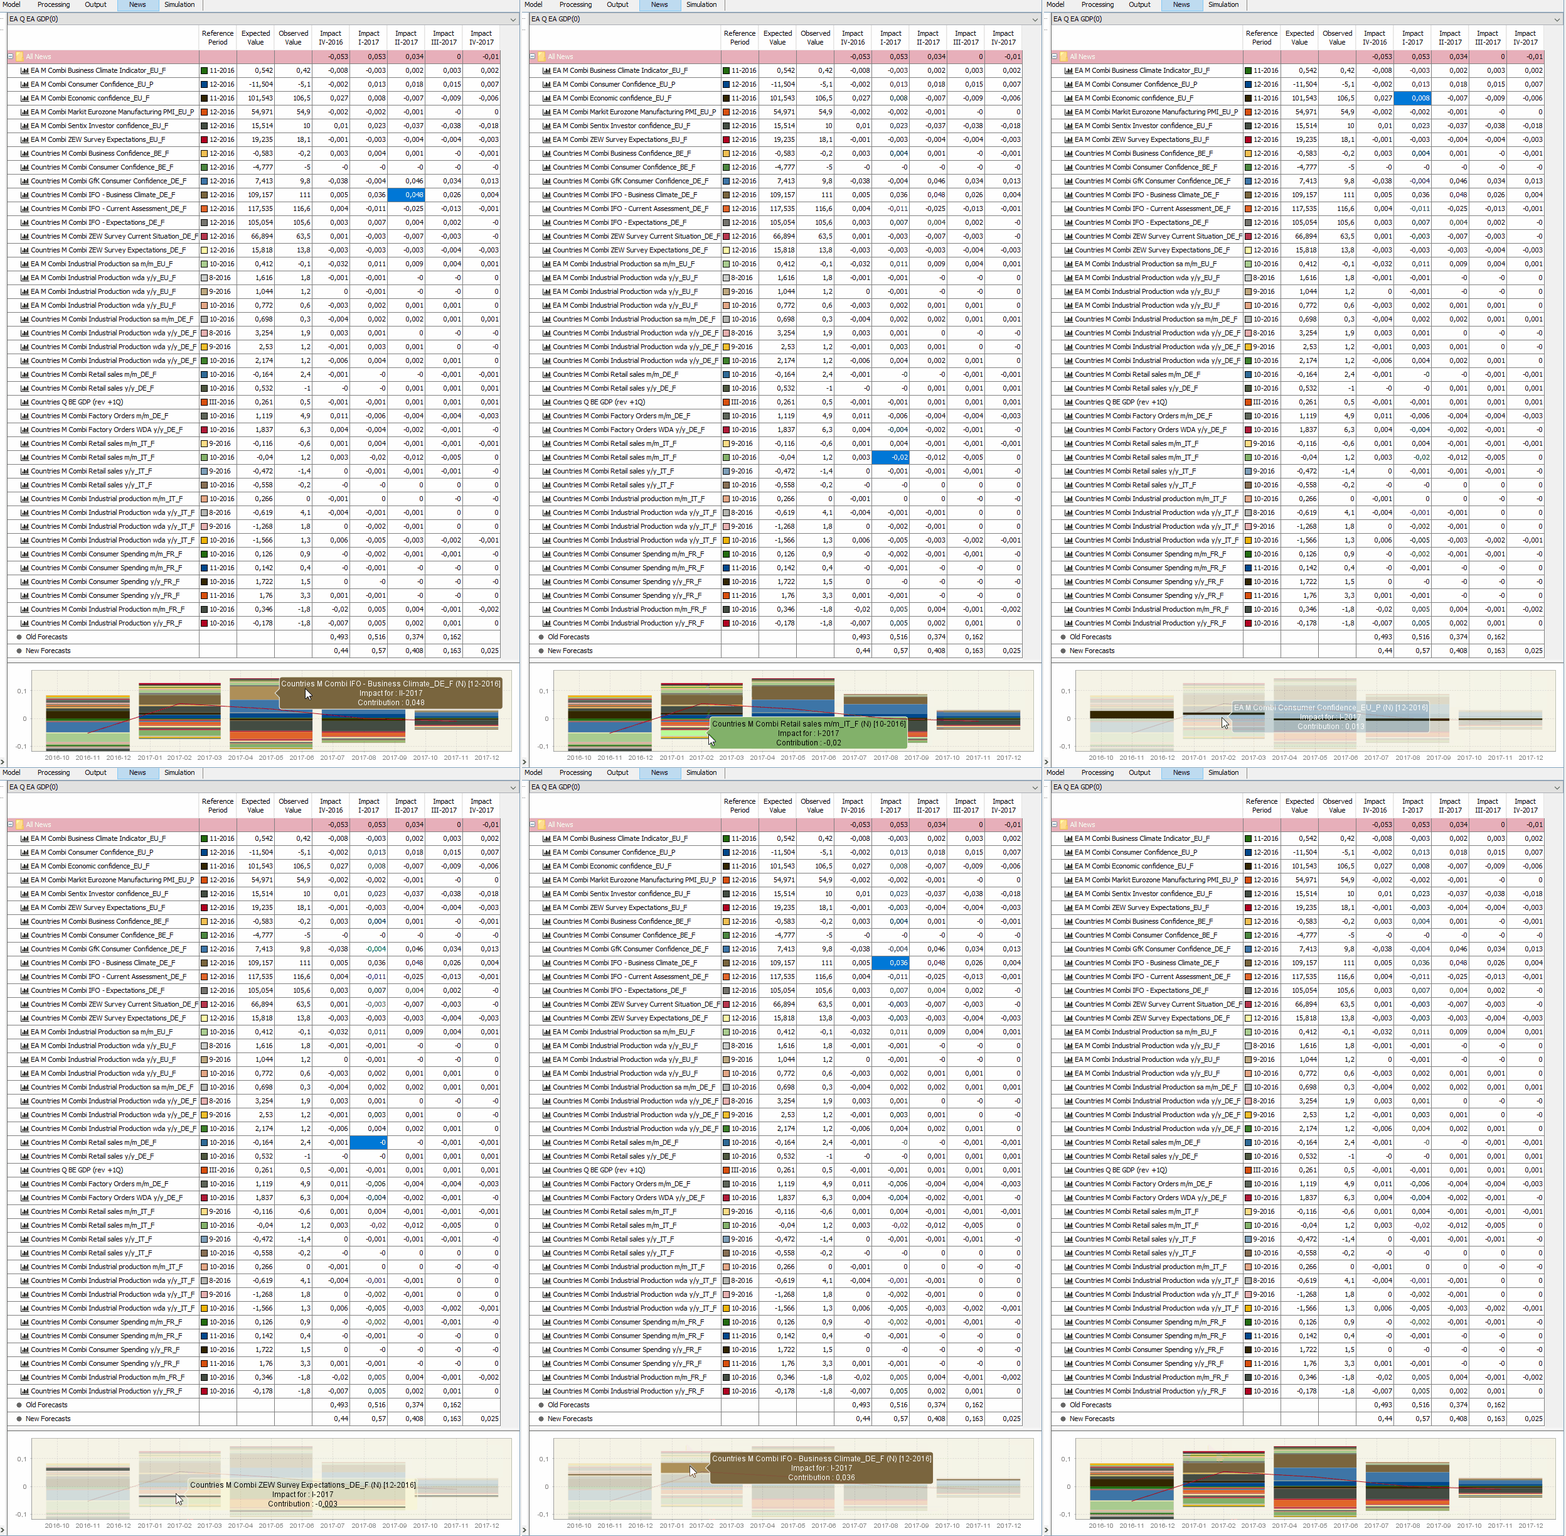
This example shows that there are many indicators contributing to the update of the nowcast for GDP over a horizon of one year, starting from the last quarter of 2016. The first column in the table represents the periods for which we have data releases. The news is the difference between the second and third columns, i.e. the expected value of the data release minus the actual value. The impacts displayed in the remaining columns represent the product of the weights displayed in the equation above and the news. If you scroll down, you will be able to see which indicators happen to have the largest contribution for this particular update.
