Overview of Seasonality tests
Here is how to access the Seasonality Tests in JDemetra+
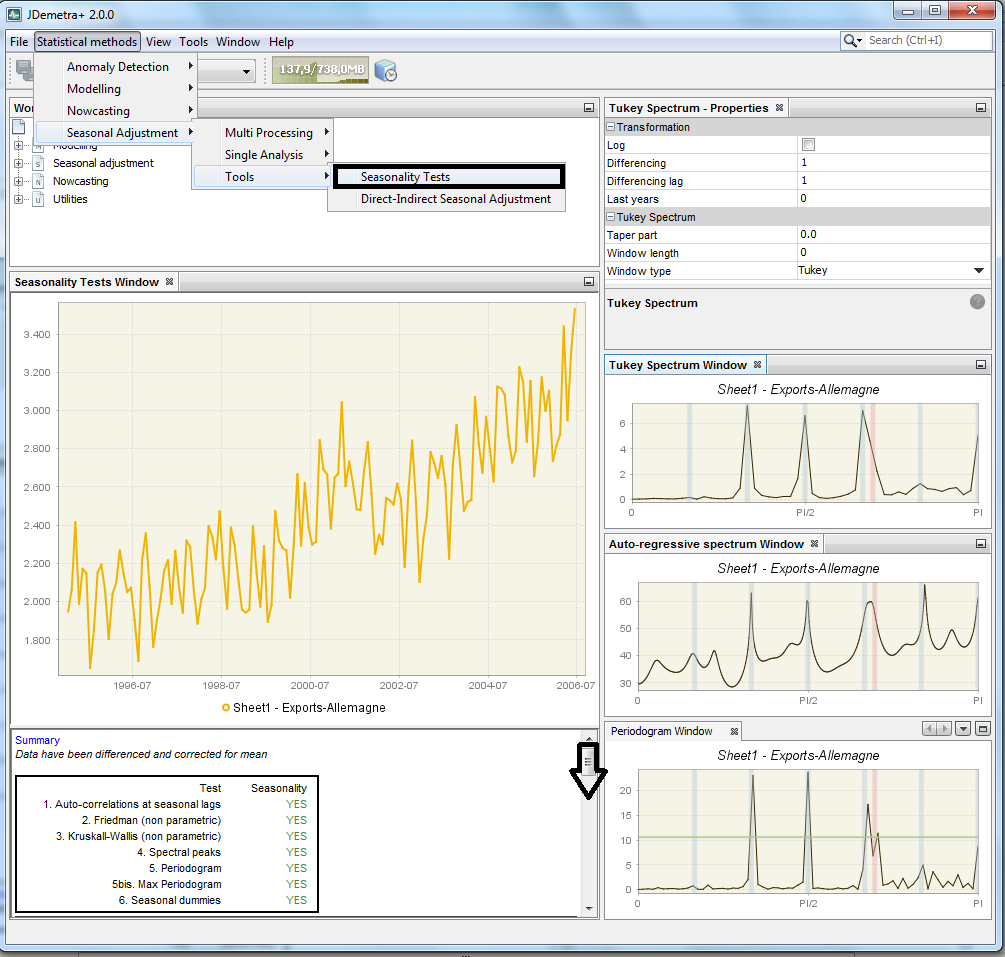
The summary results provided in this example suggest that the series under consideration contains significant seasonal components. Some of those tests rely on alternative estimates of the spectral decomposition of the data. For example, the periodogram, a smoother version of it (Tukey Spectrum), or the autoregressive spectrum, represent complementary approaches to detect seasonality and trading day effects. Both periodic patterns in the data (seasonality and calendar effects) correspond to the blue and red shadows, respectively. In this document, we describe how this methodology can be translated into formal seasonality tests that can complement the analysis of autocorrelations at seasonal lags.
There are groups of tests that can be considered to be equivalent: Friedman and Kruskall-Wallis are practically equivalent by construction, and at the same time, the test on the Periodogram and F-test on seasonal dummies, which have difference foundations, also turn out to yield very similar results. The results of those tests can be complemented with the output of the QS test on seasonal autocorrelations and with both the Autoregressive and Tukey spectral estimators, which provide a more visual diagnostic.
The test results are displayed if you scroll down: